
#5 - How To Improve The Profit of A Sports Betting Model
Exact strategies and walk through on iterating and improving profitability of a sports betting model, algorithm or strategy


Intro & Why
Understanding what segments of your bets within a model/strategy are the highest edge, and hence return the greatest ROI is essential to making the model or strategy even better in the future.
In this post I’m going to outline how I do this in a relatively simple but extremely effective way.
The Core 4 & Sub-Grouping
To start, simply compile all of your bets for the prior season/year into one doc, personally I use Google sheets for all our data, odds, reporting and analysis but anything will work, you just need to have this in a structure that makes splitting bet types easy and quick.
This is how I set the doc up, keeping everything nice and simple to begin - Just the obvious columns and then vs ATS 1 is my predicted edge margin.

What we’re looking for through this segmentation is simply to find types of bets that are either winning or losing outside of a normal range (based on the edge of the bet), from here we can further categorise them and see if there’s some part of the data we’re misrepresenting, and hence from there make the model or approach even more accurate and profitable.
The 4 easiest types of segmentation for most sports is to split your bets by: home, away and favourites/underdogs.
This is the “Core 4” - It should look like my incredibly well drawn canva image below.
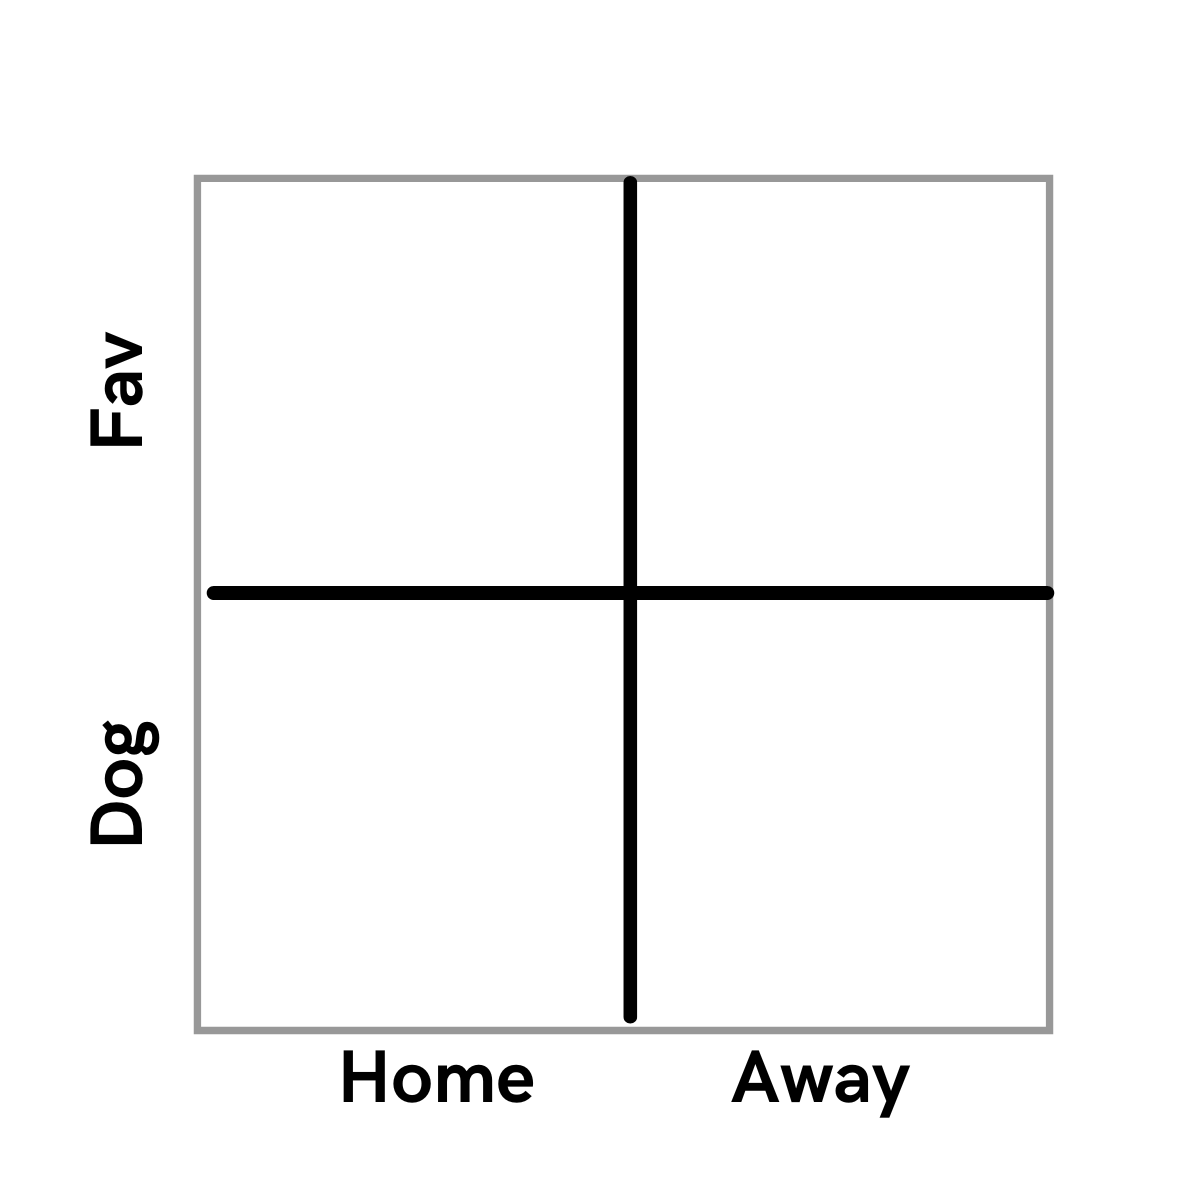
From here, you can just segment your bets for each quadrant and ensure you add the following variables to each;
Number of bets (volume of plays is essential).
W-L.
Profit/Loss
Edge % (units won / volume of bets).
From here it should be pretty clear as to where you may be going wrong.
For example, in tennis in 2023 we found that 100% of our profits came from betting underdogs, and betting favourites was massively down. Although there’s obviously no home advantage in tennis, this dog hyper-performance led us down a research rabbit hole that enabled the build of a new feature that has improved the model dramatically in 2024.
What’s more is that if you really cannot find the issue that’s causing the poor outcome then you can just add a filter to remove this based on price. For example, albeit a quick-fix that might not work long term “don’t bet favourites above XYZ price” should be enough to stop the bleeding in a lot of cases.
It’s obviously better if you can know why the actual part of this edge is broken or performing worse, but if you can’t work it out and you have a statistically significant sample size in that quadrant, adding a yes/no filter can make life a bit easier.
Going back to our high end 4-quadrant matrix, you can solve this even further and niche down; “heavy favourite” - and split by moneyline price or spread depending on your sport, or even further with “Back 2 Back game” analysis.
The issue with this though is that splitting down segments this far can actually get you down to a non significant sample size, and the results could be highly misleading (leading you towards over-optimisation and over-fitting issues in the future).
How To Refine Further Without Overfitting?
Let’s say our quadrants results have been created and its pretty obvious where the problems lie based on this.
It will also be pretty clear as the opposite quadrant will usually be extremely profitable, meaning you under-value one or two specific metrics/approaches and hence when it’s still and edge, the edge is even greater.
Below is my rugby quadrant matrix analysis so far for 2024. I’ve only used W-L as everything is ATS so all prices would be -110 and because of the obvious issue it’s not worth building out yet.

Obviously the main issue here is there’s not enough games!
So how do we continue our research and analysis without over-fitting these games and going down the wrong rabbit hole (which I’ve done far too many times to admit).
The key, in my opinion is to use game grade or ATS margin type metrics. Essentially “how much did a team win by” “did they deserve to win” “did they deserve to cover the spread” “would I make this bet again just looking at the post game stats and not the actual score” — Those are the questions we want to answer within the data.
How to answer these depends entirely on your actual approach and sport. For spread based sports I like to simply use against the spread win margin. So the result minus the spread = ATS-WM
The higher the AVG ATS-WM, the higher our confidence in that specific quadrant/edge or overall strategy.
As a quick sidenote: This approach is something I love when you have very little data, 10-15 games. If you have gone 7-8 ATS and are currently down, but things have felt “unlucky” - look into these ATS-WM type stats. In many cases you might actually just be experience a normal bit of variance. One stark example for me was NHL 2023-24 season. In December 2023 we were down -7 units but had a positive goal differential at an AVG moneyline of -120…. Which is a pretty strong indicator that you are running badly. Fast forward to Jan through to the end of the season and NHL was up every month and finished up 15 units. So sometimes you are just running badly. Although don’t kid yourself…
So here’s our updated quad with this new info for Rugby in 2024 with AVG ATS-WM integrated:

So adding these in you can see suddenly there’s some pretty interesting developments.
The first main takeaway is that Favourites clearly are going well, even though home favourites are only 5-4 ATS, we have a massive +11PTS AVG win margin ATS, so we’re getting pretty unlucky there.
The next main takeaway is despite going only 21-20 ATS so far, we’ve been pretty unlucky. The ATS margin on everything so far this season is +1.27 PTS which is alright but nothing crazy good.
And if you remember before when I mentioned “It will also be pretty clear as the opposite quadrant will usually be extremely profitable,”
This was perfectly outlined (I sweat I didn’t plan that) with the home dog being the worst performer (5-10) vs the away fav (4-0).
Action Plan / To Research:
The main tasks that related from this research and analysis were to try to understand why underdogs seem to be over-valued by this model.
And hence: how to improve the value of underdogs relative to the market based on this information.
But.
To make a confession….
I already knew that underdogs sucked in our betting model.
When you track bets closely, you can start to get an idea on the type of process that is working or not very early, way earlier than when the stats will scream it in your face like this.
As a result, we looked into why underdogs seemed to be over-valued and it termed out to be fairly interesting.
One way to dive deeper into the analysis as I mentioned previously is to look into whether heavy favourites or big-dogs do proportionally better or worse than expected based on your full sample size.
This showed nothing really wrong aside from the pure issue of over-valuing poor teams was still cropping up.
So what we needed to do was add a variable into the model that either downgraded teams (players individuals) on poor teams more, without downgrading good teams/players at all.
This is a tough fix because you want to avoid over-fitting things and also you want to seriously avoid changing your model so much that it doesn’t catch the great favourite based plays now.
Initial Results & Moving Forward
In our case, underdogs went (3-7) before this tweak and after…. 9-9…
A bit anti-climatic, but the up-side is that the AVG ATS-WM has gone all the way down to only -0.9PTS now, whereas previously this was -6PTS.
So all in all, getting closer, but still some gaps to be fixed.
For the time being as well we have changed unit sizing up slightly so that for favourites that show a large edge, these have been bet more aggressively and dogs that show a large edge have been kept at the same unit sizing.
These tweaks, albeit not “best practice” from a pure data analysis point of view, I’m optimising to make the most money at the end of the day, and even since the tweaks to the model and the (9-9 underdog results), favourites have gone 5-1 with a silly massive +21PTS AVG-WM, so we’re definitely doing something right on the iterate and optimise for profit side.

Hope you enjoyed.
Cheers,
Thomas.